Studies on metabolomics are frequently used to investigate the gut microbiota, physiological status, the fundamentals of disease, and the hunt for potential biomarkers. The high throughput methods used in metabolomics studies will generate large amounts of data for metabolic analysis, which requires the introduction of bioinformatics and statistical methods to interpret the data and to mine for deeper and more comprehensive information.
Our company provides professional services that enable deep mining and comprehensive analysis of metabolomics data knowledge, starting from raw mass spectrometry data for peak alignment, retention time correction and peak area extraction.
Service Overview
Our company offers thorough and in-depth metabolome bioinformatics analysis services. On the basis of the chemical and physical characteristics of the metabolites, we choose separation methods and detection technologies to handle various analytes. Following the acquisition of raw data, pre-processing steps such as noise reduction, retention time correction, peak detection and integration, and chromatographic comparisons are performed on the data.
After that, we use a different database to find metabolites in the spectra for non-targeted metabolomics research. Metabolites are chosen through enrichment and pathway analysis in the final data interpretation and integration process to correspond with the biological environment being studied and to provide a wider perspective when combined with different histologies.
- For metabolite structure identification, we searched the METLIN database and the HMDB database using exact mass matching (<25 ppm) and secondary spectral matching methods. When comparing the two data sets, missing values of >50% ion peaks in both sets were removed. The data were then normalized.
- Our company uses Metabo-analysis and SIMCA-P software for multidimensional statistical analysis and unidimensional statistical analysis, including PCA, PLS-DA, OPLS-DA, and pathway enrichment analysis, to ensure that comprehensive and accurate metabolomics analysis results are provided.
Research Capabilities
Our company offers a diverse range of data analysis methods for our customers' metabolomics projects, including but not limited to:
Principal Component Analysis (PCA)
PCA is an unsupervised data analysis method that reduces dimensionality by selecting several composite variables from the problem being analyzed so that they reflect as much information as possible about the original variables.
Partial Least Squares Discriminant Analysis (PLS-DA)
Unlike PCA, PLS-DA is a statistical method with supervised discriminant analysis. This method uses partial least squares regression to model the relationship between metabolite expression and sample class to achieve the prediction of sample class.
Orthogonal Parast Squares Discriminant Analysis (OPLS-DA)
OPLS-DA is a modified analysis method of PLS-DA, which can filter out the noise unrelated to the classification information and improve the analysis ability and validity of the model.
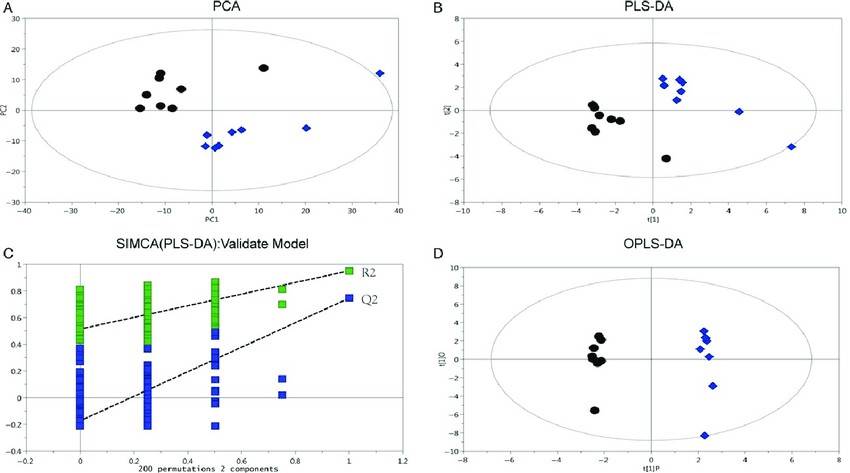 Fig.1 Score plots of PCA, PLS-DA, and OPLS-DA based on the metabolite profile data of HCC and wild-type liver tissues. (Fan T, et al. 2017)
Volcano Diagram
The univariate analysis method is the simplest and most commonly used method for analyzing experimental data, which can visualize the significance of metabolite changes between two samples, thus helping us to screen out potential marker metabolites.
Random Forest
This is a machine learning method that can distinguish between two groups before dimensionality reduction i.e. multivariate, independent of high dimensional data. The random forest method uses a classification tree algorithm by which the metabolic group data is divided into multiple groups while assessing the importance of the variables.
If you are looking for smarter, higher quality solutions that incorporate best practices, please feel free to contact us.
Reference
- Fan T, et al. (2017). "Metabolomic and Transcriptomic Profiling of Hepatocellular Carcinomas in Hras12V Transgenic Mice." Cancer Medicine. 6(10): 2370-2384.
It should be noted that our service is only used for research, not for clinical use.